Security Hub
Security Hub provides a consolidated snapshot of API security by bringing together key metrics and trends into a single view. Administrators have visibility into metrics and trends across all applications, while Users see data only for the applications they are authorized to access. Information is refreshed every 10 minutes through optimized caching to ensure up-to-date insights without impacting performance.
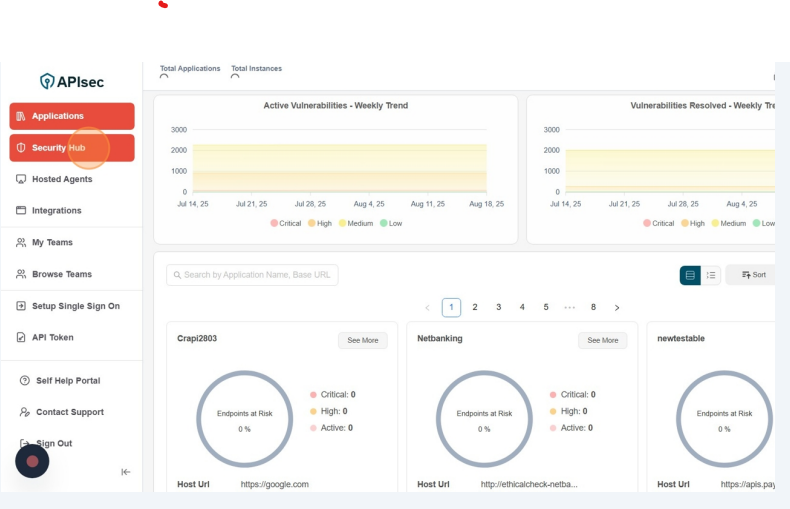
Visit Security Hub.
- Click "Security Hub" present on the left panel.
Overview
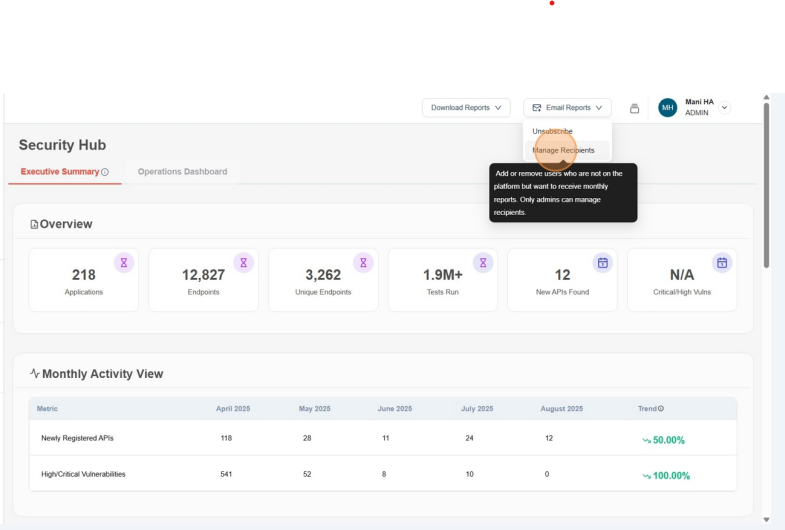
Provides summarized counts including the total number of applications, endpoints, and unique endpoints, as well as test runs executed, newly discovered APIs, and the number of critical or high-severity vulnerabilities detected.

Monthly Activity View
New Registered API
- This gives a breakdown of applications created per month for the last six months.
High/Critical vulnerabilities
- This gives a breakdown of high/critical vulnerabilities detected per month for the last six months.
Trend indicate month-on-month percentage (MoM %=Current−Previous/max(Previous,1) ×100)

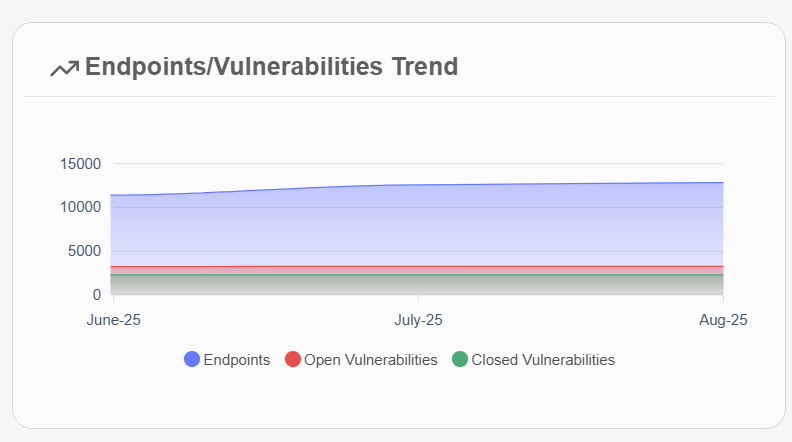
Endpoints/Vulnerabilities Trend Chart
-
Shows trends on open and closed vulnerabilities across all endpoints over last six months.
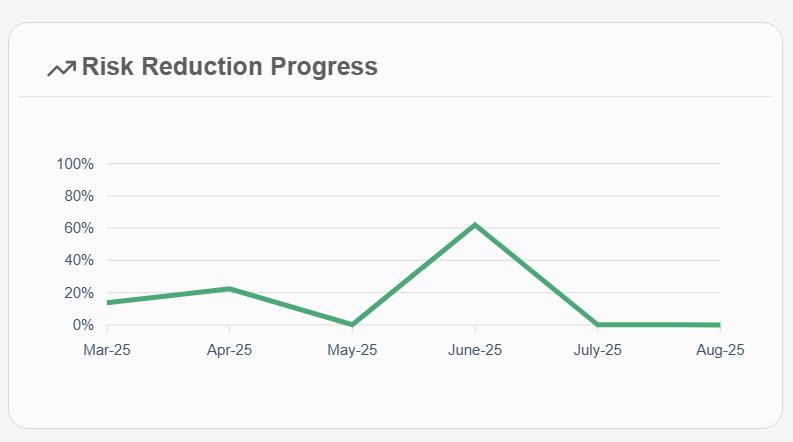
Risk Reduction Progress
-
Shows trends on progress of closing vulnerabilities over last six months.
Key Performance Indicators
Teams Engaged
- It shows user break down of all teams, how many teams are created in the current month and number active teams.
Resolution Rate
- It gives the overall vulnerabilities resolution trend for the current month.
Security Coverage Growth
- It gives a break down of api gateway expansion for current month.
High-Risk Exposure
-
It gives an all time break down of critical/high vulnerabilities detected and gives the number of new vulnerabilities detected in the current month.

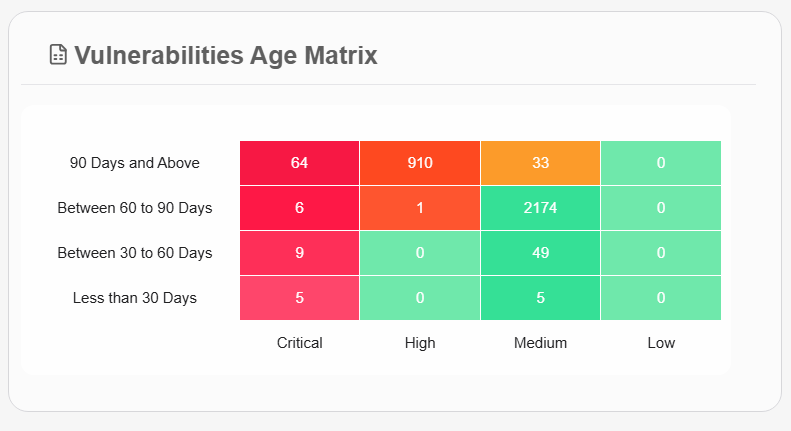
Vulnerability Age Matrix
- Shows unresolved vulnerabilities categorized by severity (e.g., critical, high, medium, low) and how long they have remained open. This helps track aging issues, prioritize remediation, and identify risks that have been left unaddressed over time
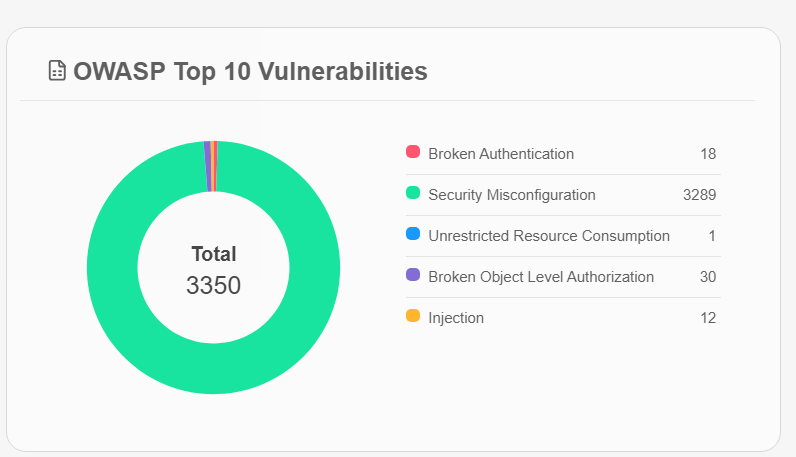
OWASP Top 10 Vulnerabilities Breakdown
-
Displays a donut chart that visualizes the distribution of detected vulnerabilities across the OWASP Top 10 categories. Each segment of the chart represents a category,
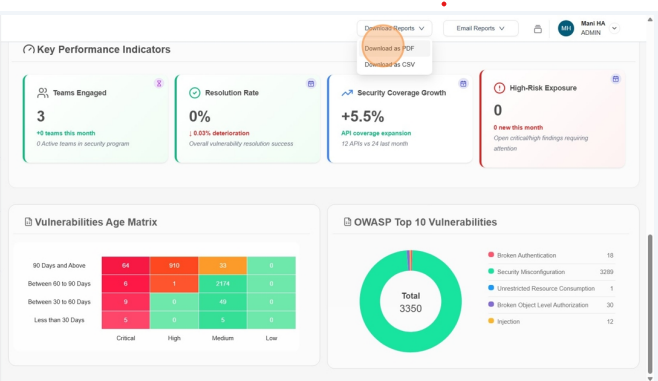
DownloadasPDF
- Click Download as PDF to download the report.
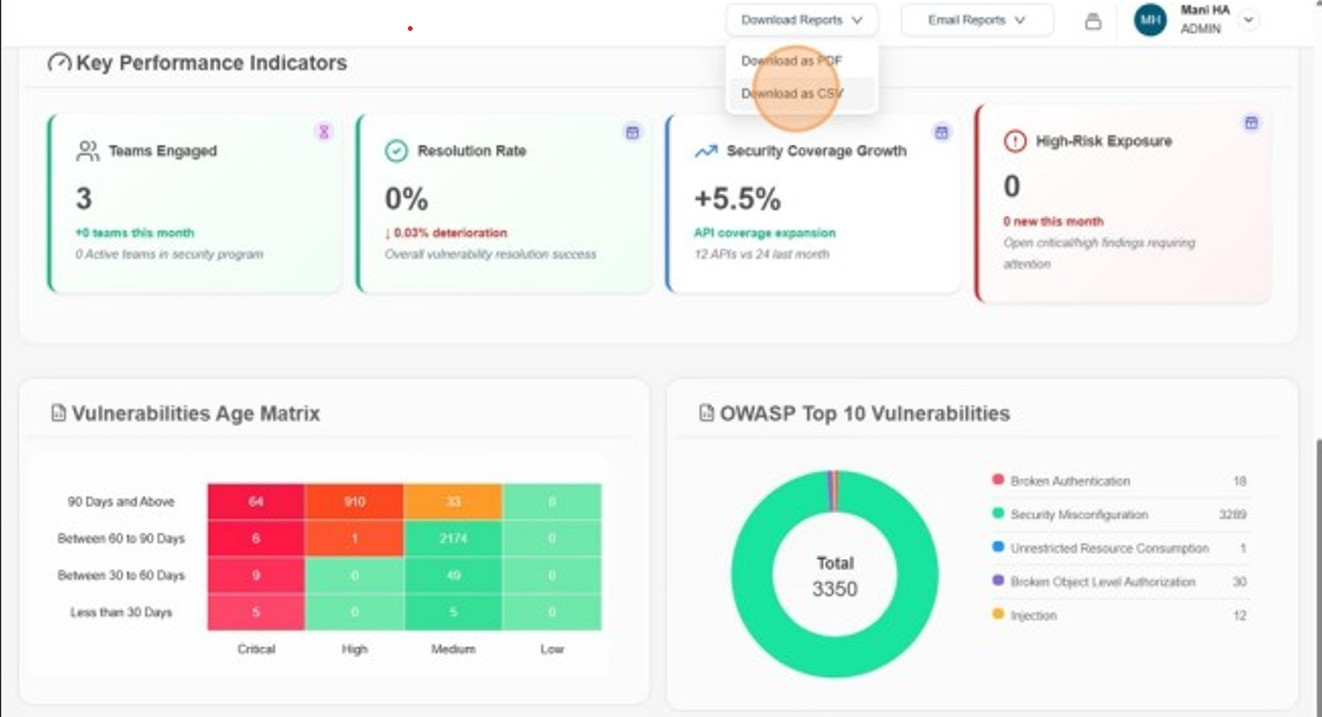
DownloadasCSV
- Click Download as CSV to download the trend of Vulnerabilities.
Subscribe
- Click Subscribe to Subscribe

Manage Recipients
- Click Manage Recipients
